
Xuanwu Yue
PhD, CSE, HKUST
Xuanwu Yue is currently a Senior Data Analytics at Nanjing AI Institute of Sinovation Ventures.
His primary resesarch lies in visual analytics of financial data with particular focuses on quantitative traiding, market analysis and high frequency trading.
Prior to joining Sinavation Ventures, Xuanwu completed his Ph.D. in the Department of Computer Science and Engineering at The Hong Kong University of Science and Technology (HKUST) under the supervision of Prof. Huamin Qu in HKUST VisLab(2016.09 - 2020.06).
He obtained his B.Eng. degree from Software School, Shandong University in June 2016. During his undergraduate studies, he was also a research assistant at The Interdisciplinary Research Center (IRC) supervised by Prof. Baoquan Chen and Prof. Yunhai Wang.
Personality
Tech Zealots
Enjoy every tech improving moment and achievement obtained by coding.
Ideas
Creative thinking, moreover critical thinking promote my mental judgement.
Social
Not only the social skills but also the leadership enhance my horizon towards this gorgeous world.
Entrepreneurship
Endless passion to facilitate the computer and technology world.
Shots from Blog
Reconstruction of Xuanwu.info
From here. I will go anywhere. YUE Xuanwu 2016/11/06
View more-
Photographer
-
50+
Projects Done
-
Pro. Basketball Player
-
200+
Coffee Cups
-
Heavy User
Resume
- Education -
-
Hong Kong University of Science and Technology
PhD Candidate
2016 - NowComputer Science & Engineering Supervisor: Prof. Huamin QU
-
Shandong Univeristy, China
Bachelor of Engineering
2012 - 2016Software Engineering Software Department GPA: 89.29 / 100 Rank: 4 / 299
- Employment & Summer School -
-
Network Security Research Lab, Qihoo 360
Software Developer
2015.12 - 2016.03Developed visual analysis system towards enormous security NetFlow data and WHOIS information.
-
Google China
Summer Camp of Technology
2014.07Held in Fudan University, Shanghai, China.
-
Peking University
Information Visualization Graduate Summer School Program
2014.07Supervisor: Prof. Xiaoru YUAN
Professional Skills
Primary Recognition
ACM / CCF / CAAI Member
National Scholarship, MOE, China
Outstanding Graduates of Shandong Province, China
Outstanding Graduates of Shandong University, China
Dean Scholarship of Software College, Shandong University, China
-
2015 Alibaba Group Campus Recruitment Offer
Algorithm Engineer
Hangzhou, China
-
2015 National Youth Innovation and Entrepreneurship Competition
First Class
MOHRSS, Beijing, China
-
2014 ACM-ICPC Invitational Contest, Shanghai, Asia
Bronze Medal
Shanghai, China
-
2014 ACM-ICPC Invitational Contest, Beijing, Asia
Bronze Medal
Beijing, China
Portfolio
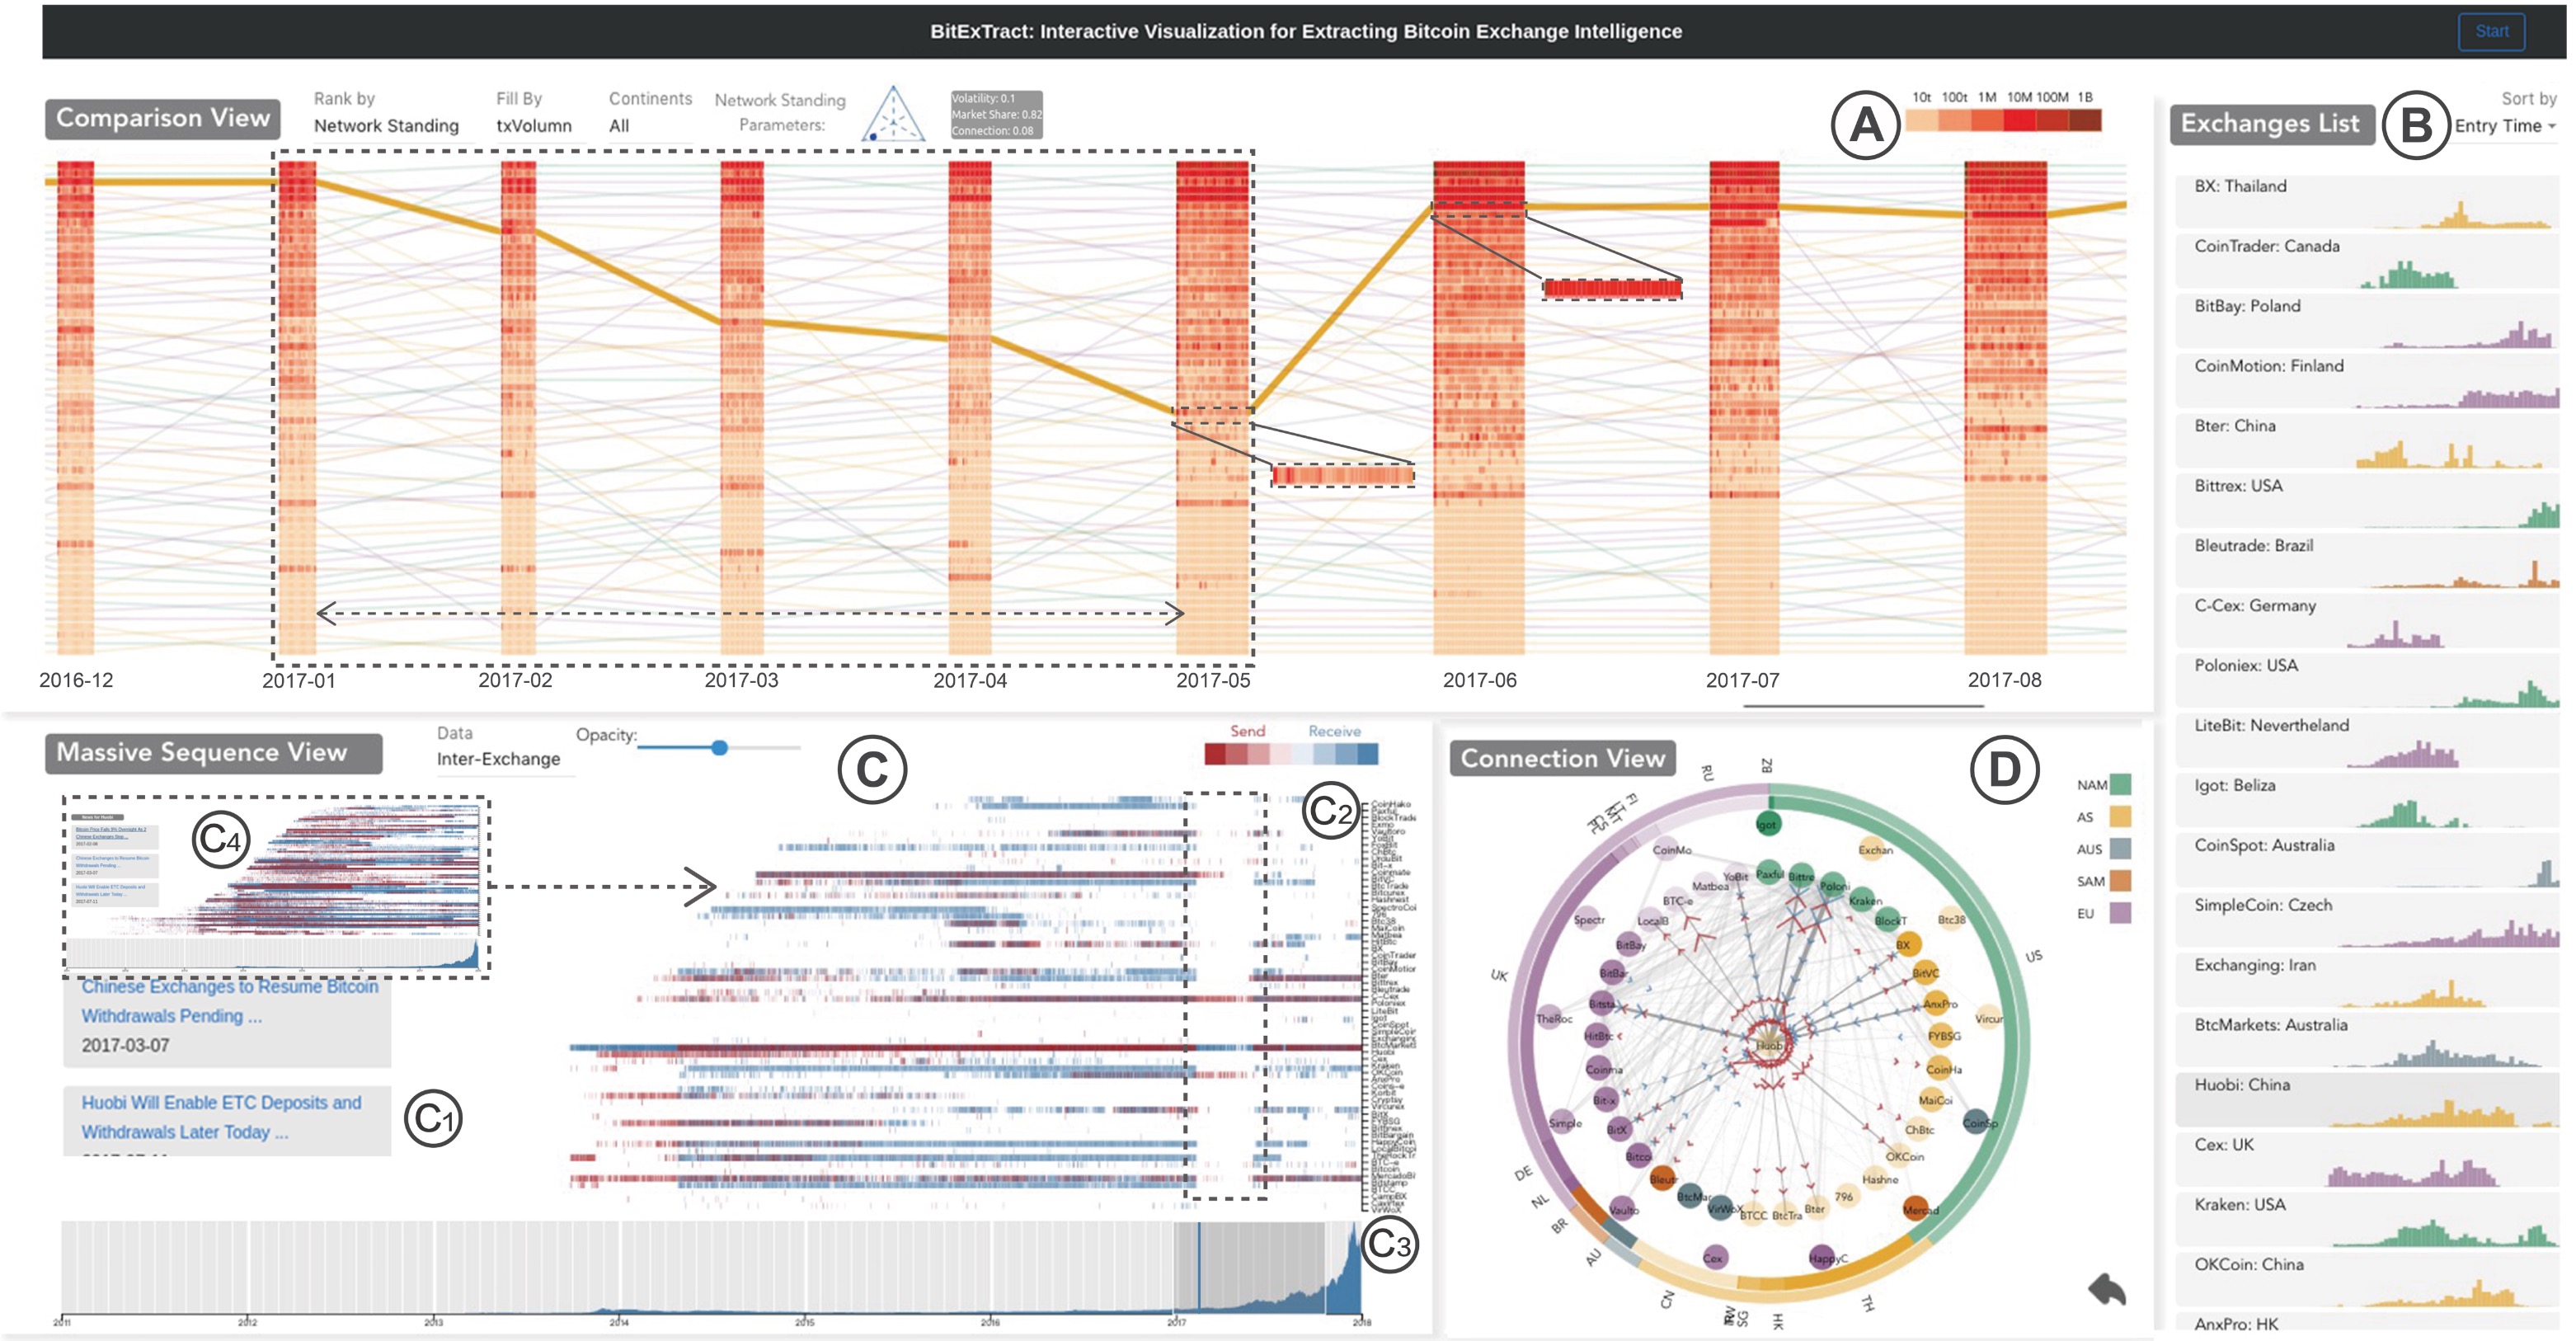
BitExTract
IEEE Transactions on Visualization and Computer Graphics (Proceedings of VAST)…
Explore
IEEE Transactions on Visualization and Computer Graphics (Proceedings of VAST) October 2018
The emerging prosperity of cryptocurrencies, such as Bitcoin, has come into the spotlight during the past few years. Cryptocurrency exchanges, which act as the gateway to this world, now play a dominant role in the circulation of Bitcoin. Thus, delving into the analysis of the transaction patterns of exchanges can shed light on the evolution and trends in the Bitcoin market, and participants can gain hints for identifying credible exchanges as well. Not only Bitcoin practitioners but also researchers in the financial and statistics domains are interested in the business intelligence behind the curtain. However, exploration and comparison among multiple exchanges has been rather limited due to the lack of efficient tools. Previous methods of visualizing Bitcoin data have mainly concentrated on tracking suspicious transaction logs, but it is cumbersome to analyze exchanges and their relationships with existing tools and methods. In this paper, we present BitExTract, an interactive visual analytics system, which, to the best of our knowledge, is the first attempt to explore the evolutionary transaction patterns of Bitcoin exchanges from two perspectives, namely, exchange versus exchange and exchange versus client. The BitExTract system’s analysis concentrates on three different levels: the overall-market level, the inter-exchange level, and the individual level. In particular, BitExTract summarizes the evolution of the Bitcoin market by observing the transactions between exchanges over time via a massive sequence view. A node-link diagram with ego-centered views depicts the trading network of exchanges and their temporal transaction distribution. Moreover, BitExTract embeds multiple parallel bars on a timeline to examine and compare the evolution patterns of transactions between different exchanges. The effectiveness and usability of BitExTract are demonstrated through three case studies with novel insights and further interviews with domain experts and senior Bitcoin practitioners.
👇 Video (The online demo is on the way…)
See Live
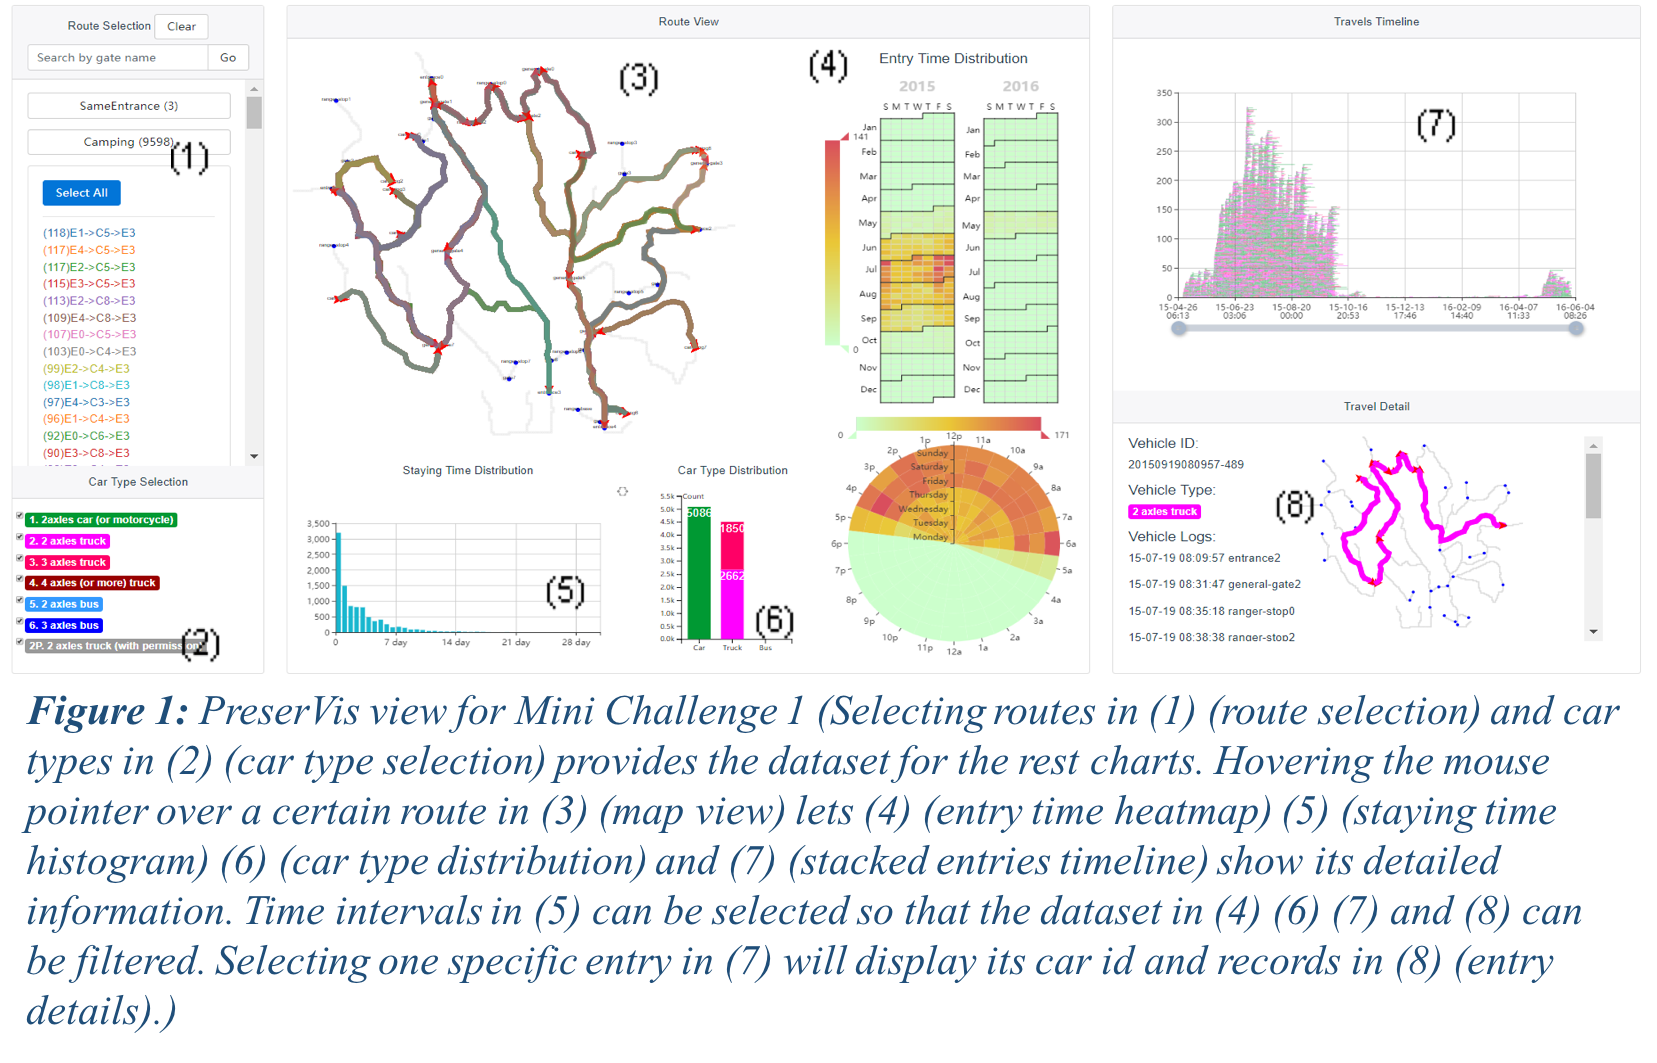
PreserVis
VAST Challenge 2017 Multi-challenge Award: Compelling Synthesis of Information The…
Explore
VAST Challenge 2017 Multi-challenge Award: Compelling Synthesis of Information
The theme of VAST Challenge 2017 is to explore the reasons why the number of a kind of bird, Rose-Crested Blue Pipit is decreasing in Boonsong Lekagul Nature Preserve. It is divided into three Mini Challenges and a Grand Challenge.
Mini Challenge 1 (MC1) is related to the transportation in the preserve. With the records of the vehicles passing through the preserve in a 13-month period, we discovered 9 traffic patterns and some other outliers.
Mini Challenge 2 (MC2) requires the discovery of the unexpected patterns in the data of the monitors’ readings of different chemical pollutants and further the localization of the source of each pollutant.
In Mini Challenge 3 (MC3), 12 remote sensing images with 6 spectra were provided, based on which we developed the patterns of different areas and analyzed the changes along the timeline.
👇 Online version
See Live
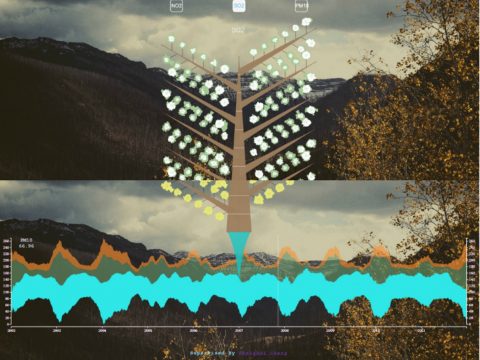
Naturevis
Supervisor: Mr. Shenghui CHENG (Stony Brook University) As for the traditional…
Explore
Supervisor: Mr. Shenghui CHENG (Stony Brook University)
As for the traditional air data, on the one hand, they can be regarded as time series data that display the changing trends. On the other hand, they are also separated, individual data, which can describe everyday situation. Inspired by Cheng’s previous paper, visualize the air data into a “tree” and streamline. The contribution includes implementing ‘L-System’ by JavaScript(Web) and so on. This work is still under processing and have more to improve and perfect.
👇 Online version
See Live
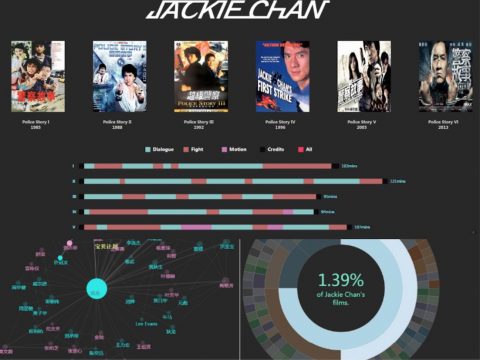
MovieVis
Based on my admiration to Jackie Chan, I collect the…
Explore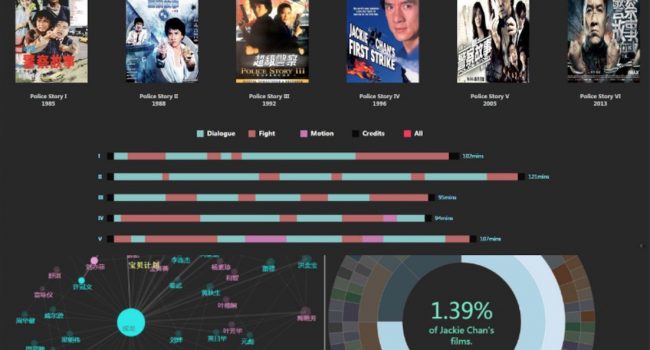
Based on my admiration to Jackie Chan, I collect the data of Jackie Chan’s movie by Python Spider. Form the data using the typical visualization patterns.
👇 Online version
See Live
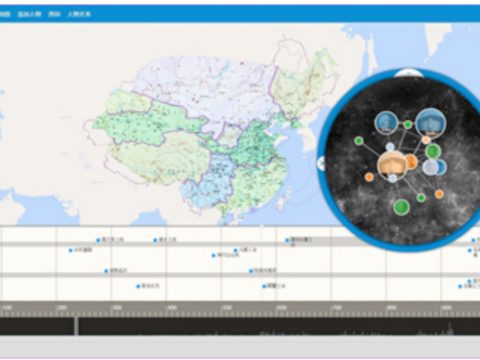
HistoryMapVis
Supervisor: Prof. Baoquan CHEN(Shandong University) In order to have a…
Explore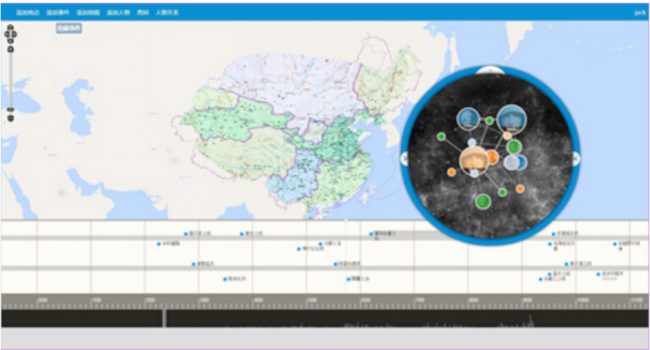
Supervisor: Prof. Baoquan CHEN(Shandong University)
In order to have a more comprehensive way towards the history data. We build this HMap website. Combine the map, timeline and some user guide interactions. We provide two languages,Chinese and English, supported.
Owing to some insufficiency, the website is still under developing. So we build it on our university’s Intranet, which is inaccessible from the Extranet.
Features:
- Only registered user are permitted to log in.
- Users can add the historical person and events, which based on the concept of ‘Crowdsourcing’.
- We use some projections to map the historical maps that the users uploaded.
- The user can also query the specific people and events.
- The queried results consists of the synopsis of events.
- Character relationships.
- The significant places and routes for this queried people.
- Corresponding video from current video-sharing websites like ‘youtube.com’ or ‘youku.com’
- We also propose the heatmap of historical events based on the users interactions like selecting years in the timeline.
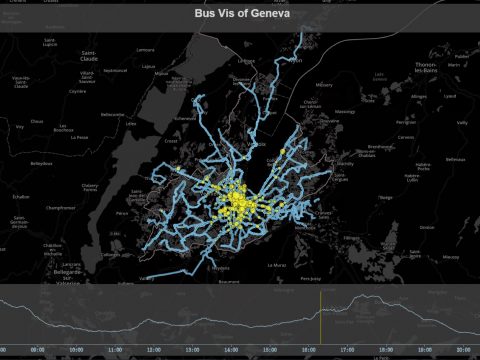
BusVis
Supervisor: Prof. Xiaoru YUAN (Peking University) The original bus data…
Explore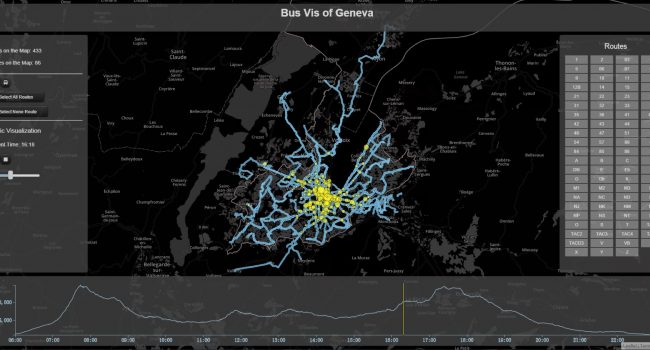
Supervisor: Prof. Xiaoru YUAN (Peking University)
The original bus data of Geneva include the routes, stops, number of passengers and etc. In order to present the trend of public traffic more efficient. I implement this website with some interactions like the traffic animation of the whole day, listing specific routes and stops the users choose. As for the animation, the timeline can not only play sequentially, but also allows to adjust the speed and click somewhere particularly.
👇 Online version
See Live

Shiyida(世易大)
Shiyida - Information Exchange Platform of Shandong University Owing to…
Explore
Shiyida – Information Exchange Platform of Shandong University
Owing to the uneven campus distributions of Shandong University, the importance of exchanging information via students has enhanced day by day. Based on this exceptive situation, I developed this platform, Shiyida (世易大 in Chinese), used Node.js, Redis & Aliyun ECS within two months, including developing and testing.
The website is under reconstruction…
Some Words from Them
Waiting for Your Testimonial...
All Welcome
-
Photographer
-
50+
Projects Done
-
Pro. Basketball Player
-
200+
Coffee Cups
-
Heavy User
Contact
Drop me a line
-

HKUST, Hong Kong, China
-

+852 65653553
-

[email protected]